How to Improve Yield Rate in Glass Container Manufacturing

Time:2026-10-31 Author:Oliver
0%

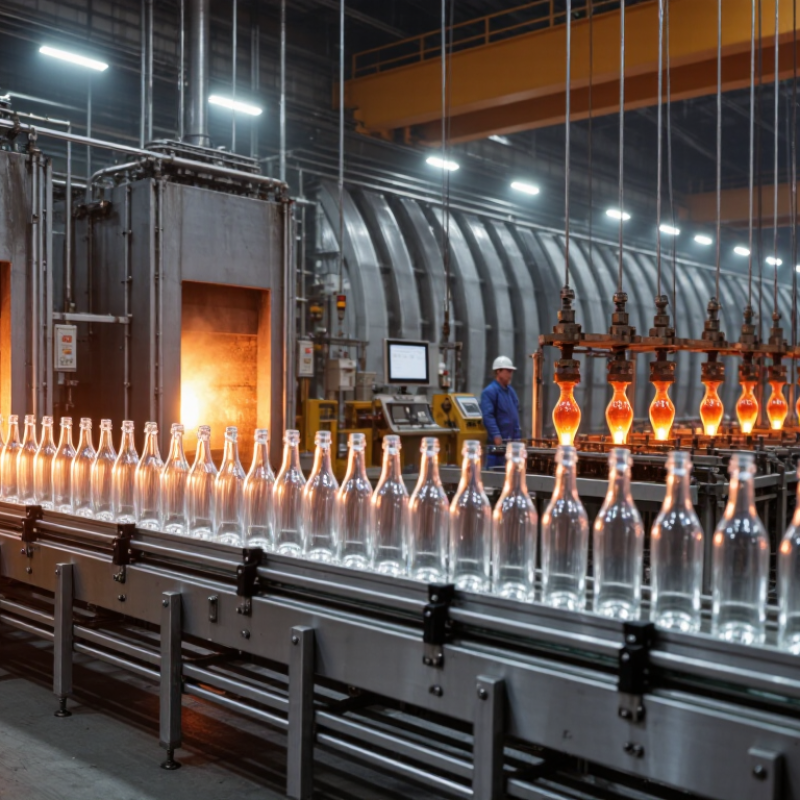
Glass container yield is shaped long before bottles reach inspection. Batch consistency, furnace stability, gob weight, forming pressure, and annealing all influence how many containers pass quality checks. Small variations can leave visible consequences: a seam that feels rough, a base that is too thin, or a bottle that cracks during cooling. Better yield requires process control across the line, not just faster inspection.

Industry figures offer useful context, though they do not measure factory yield directly. FEVE reported an 80.1% glass packaging recycling rate in Europe for 2022, based on its published industry data. The U.S. Environmental Protection Agency reported a 31.3% recycling rate for glass containers in 2018. These figures describe recycling, not the percentage of saleable containers produced. That distinction matters. Recycling rates cannot be used as a substitute for plant-level reject data.

This guide examines how to improve the yield rate of glass container manufacturing through measurable controls: tracking defects by machine and shift, checking gob temperature, and reviewing annealing lehr profiles. Experienced operators often spot drift before a dashboard makes it obvious. But instinct alone is not enough. A plant should compare inspection records with process data and verify whether corrective actions actually reduce rejects. Some losses are stubborn. Even a well-tuned line can produce defects when raw materials or operating conditions change, so improvement needs regular review.
How to Improve Yield Rate in Glass Container Manufacturing

Understanding Yield Rate and Identifying Production Losses

Yield rate shows how many formed containers meet specification on the first pass. Calculate it as accepted containers divided by total containers formed, using the same production stage and time window. Keep reworked or remelted glass separate: it may recover material, but it does not erase a first-pass defect. Small losses add up.

Track rejects by defect, machine, cavity, and shift. A hot-end camera may reveal repeated checks near one mould, while finish damage can point to handling after forming. Record temperature, gob weight, mould condition, and timing beside each spike; otherwise, teams may mistake a symptom for the cause. The European Commission’s Best Available Techniques Reference Document for Glass Manufacturing reports that a 10% increase in cullet use can reduce melting energy demand by roughly 2.5–3%. That is an energy benefit, not a yield gain. Keep the measures distinct. A messy truth: some defect codes are too broad to guide action. Review samples at the line, tighten those codes, then compare first-pass yield across shifts before changing settings.

How to Improve Yield Rate in Glass Container Manufacturing - Understanding Yield Rate and Identifying Production Losses

Illustrative production lot: 100,000 containers entering the forming stage
Production Stage Units Entering Units Lost Stage Loss Rate Stage Yield Typical Losses to Monitor Practical Improvement Focus
Forming and hot-end inspection 100,000 6,200 6.20% 93.80% Checks, uneven wall distribution, finish defects, stones, blisters, and shape variation Stabilize gob weight and temperature; review machine timing, mold condition, and hot-end inspection trends.
Cold-end inspection 93,800 2,700 2.88% 97.12% Cracks, dimensional nonconformance, finish defects, and defects missed or not detectable at the hot end Track rejects by defect type and machine section; verify inspection settings and confirm dimensional checks are in control.
Packaging and handling 91,100 300 0.33% 99.67% Breakage, scuffing, and container damage during transfer or packing Check conveyor transfers, guides, pack patterns, and handling points; record breakage by location and shift.
Overall saleable output 100,000 9,200 9.20% 90.80% Saleable containers after forming, inspection, and packaging losses: 90,800 units.

Calculation: Stage loss rate = units lost at that stage ÷ units entering that stage. Overall yield rate = saleable output ÷ units entering production × 100. Figures are illustrative and should be replaced with production-line records for operational reporting.

Preparing Consistent Batch Materials and Furnace Conditions

Yield losses often begin before molten glass reaches the forming machine. Small shifts in sand moisture, cullet cleanliness, or carbonate content can change melting behavior. Keep incoming materials within documented ranges, and check moisture after storage or rain. That check matters. Use calibrated scales and a repeatable charging sequence; record batch weights by shift. Even clean cullet can carry ceramics or metals, so visual sorting and periodic sampling help prevent stones, seeds, and discoloration.

Batch consistency alone is not enough. Furnace temperature, pressure, and combustion balance must remain steady across the melting and refining zones. Operators should review trend charts alongside glass defects, rather than reacting to one reading. Measure at consistent locations and times. Check thermocouples and sensors against maintenance schedules; drifting instruments can make a stable furnace look unstable. A perfectly uniform batch is an aspiration, not something to assume.

Stable does not mean identical. Production changes and refractory wear still matter, and some variation will remain. Make adjustments in small steps, document them, and check the resulting glass at the forming line. If a defect rate improves briefly and then returns, revisit the batch records and furnace trends before changing several settings at once.

Optimizing Glass Forming and Container Annealing

In glass container production, yield is often lost in small, repeatable defects: checks near the finish, uneven wall thickness, and stones that appear after forming. Watch the gob’s temperature and weight alongside feeder timing. A narrow temperature drift can change how glass stretches inside the mold. Track defect counts by machine section and shift; plant averages can hide one persistently weak cavity.

Forming and annealing must be tuned together. A bottle leaving the lehr too hot or cooling too quickly may retain stress, then crack during inspection or packing. Map lehr temperatures with calibrated sensors, and verify the profile using polariscopic checks rather than trusting set points alone. The Glass Packaging Institute reports that each 10% increase in cullet can reduce energy use by about 2–3%. FEVE’s 2021 data report an 80.1% glass packaging recycling rate in Europe. These figures support careful cullet use, but they do not guarantee higher yield; inconsistent cullet quality can complicate melting and forming.

Small shifts matter. Review reject patterns after every adjustment, and change one variable at a time. One uncomfortable lesson: a smoother production run can still conceal rising internal stress. I would not treat a single day’s inspection results as proof that an annealing change worked. Keep samples from before and after each trial, then compare breakage, dimensional checks, and stress readings across several shifts.

Detecting Defects Through In-Process Quality Control

How to Improve Yield Rate in Glass Container Manufacturing

Detecting Defects Through In-Process Quality Control

In glass-container production, a small forming fault can become a full reject several stations later. Hot-end cameras can flag uneven parisons, malformed finishes, and visible checks while bottles are still warm. Cold-end inspection then examines cracks, stones, blisters, and dimensional variation under controlled lighting. Catch defects early. A brief pressure change or worn mold can leave a repeating mark across hundreds of containers. Operators should link inspection images to machine settings and shift records, so corrections target causes rather than symptoms.

ASQ’s Cost of Quality guidance estimates that poor quality can cost organizations 5% to 30% of gross sales, depending on how costs are measured. That range is broad, but it shows why scrap and rework deserve close tracking.

In glass plants, useful checks include defect counts by cavity, reject trends by hour, and confirmation samples after adjustments. Keep limits visible at the line. If a camera’s false-reject rate rises, verify lighting and calibration before changing the process. No system catches everything. Manual checks still matter, and rushed sampling can miss intermittent defects. I would also question any “perfect” dashboard: data can look clean while a real flaw slips through.

Using Production Data to Reduce Scrap and Improve Yield

How to Improve Yield Rate in Glass Container Manufacturing

Yield improvement starts with knowing where good containers are lost. Track scrap by forming machine, cavity, shift, and defect type. A daily dashboard can reveal patterns that broad monthly totals hide. For example, a rise in checks near the finish may follow a temperature change or a mold adjustment. Compare defect counts with gob weight, glass temperature, cycle time, and inspection results. Use consistent definitions, or teams may record the same flaw differently.

Production data is useful only when operators can act on it. Review trends at shift handover, then investigate one clear change at a time. If shoulder cracks increase after a speed adjustment, check the relevant machine settings and sample containers from that period. Confirm findings against physical inspection before changing a stable process. Data can be noisy. Manual entries may be late or incomplete, and that is worth admitting. A chart is not proof by itself. Keep records of adjustments and check whether scrap falls without creating new defects elsewhere.

Tips: Separate defects by location and severity. Calibrate inspection equipment on a regular schedule. Record downtime and process changes beside scrap figures. Start with a small trial, compare similar production runs, and share the result with operators. If the numbers disagree with what the line shows, investigate the gap before making a decision.

FAQS

What defects can hot-end cameras detect?

They can flag uneven parisons, malformed finishes, and visible checks while containers are still warm. They do not catch everything.

What does cold-end inspection look for?

Under controlled lighting, it checks for cracks, stones, blisters, and dimensional variation. Manual checks still matter.

Which production details help trace recurring defects?

Track defect counts by machine, cavity, shift, and type. Record mold adjustments, temperature changes, and downtime beside scrap figures.

How can operators respond to a sudden rise in defects?

Review the relevant machine settings and inspect samples from the affected period. Change one clear factor at a time, then confirm the result.

Why should teams use consistent defect definitions?

Different descriptions can make the same flaw appear as separate problems. Clear categories make shift and cavity comparisons more useful.

What should operators check if a camera rejects more containers than usual?

Verify the lighting and calibration before changing the process. A dirty lens or poor setup may distort the results.

How can production data help improve yield?

Compare reject trends with gob weight, glass temperature, cycle time, and inspection results. Start with a small trial and compare similar runs.

Can a dashboard prove that a process is stable?

No. Manual entries may be late, and intermittent flaws can escape sampling. Check the glass, too. A clean chart can still be misleading.

Conclusion

Improving yield in glass container manufacturing begins with understanding how yield is measured and identifying where losses occur, from material preparation to finished-product inspection. Consistent batch composition and stable furnace conditions help reduce variations in melting quality, while carefully controlled forming parameters support uniform containers and fewer production defects. Proper annealing is also essential: steady temperature control and cooling reduce internal stress and the risk of cracking.

To determine how to improve the yield rate of glass container manufacturing, producers can combine in-process quality checks with reliable production data. Early detection of defects allows teams to adjust equipment and process settings before more containers are affected. Tracking scrap rates, defect types, and production conditions over time reveals recurring causes of loss and helps prioritize corrective actions. By coordinating material control, forming, annealing, inspection, and data review, manufacturers can reduce waste and achieve more consistent output.

Oliver

Oliver

Oliver is a seasoned marketing professional with a wealth of expertise in driving brand awareness and engagement. With a deep understanding of our company's product offerings, he consistently delivers high-quality content that enriches our professional blog. His insights not only shed light on......